Article metadataPassed
Title and article content are available.
Substack-ready preview
This page uses the same renderer as the RSS feed. It shows the article after LaTeX references, tables, figures and citations have been prepared for external publication.
Automated validation
Title and article content are available.
No unresolved LaTeX references or structural commands were detected in the prose.
All 5 figures have a displayable asset.
5 citation keys will remain visible because no bibliography was supplied. This does not block publication.
The article parser did not report structural warnings.
Article preview
Banking transaction data contain rich information on financial behaviour, customer interactions and potential risk patterns. However, their sensitivity, heterogeneity and relational structure make them difficult to analyse, share and reconstruct in a statistically meaningful way. This paper proposes a network-based distributional framework for reconstructing account-level transactional behaviour in banking data. Each bank account is represented as an empirical probability distribution over ordered transaction amount classes, transforming raw transactional activity into an account-level financial profile. Behavioural networks are then constructed by linking accounts according to similarity in their transactional features. Alternative network topologies, including cosine similarity, k-nearest-neighbour and minimum spanning tree networks, are compared as propagation channels. Hidden account-level distributions are reconstructed through a Wasserstein barycentric propagation procedure, and reconstruction accuracy is evaluated using repeated masking experiments and Wasserstein distances between true and reconstructed profiles.
The content below is generated from the stored article and is not separately editable. Changes must be made in the original Overleaf project and republished.
Banking transaction data are a central source of information for modern financial analytics. They record how accounts interact, how money flows across the system and how financial behaviour evolves over time. Such information is crucial for applications including transaction monitoring, anti-money laundering (AML), fraud detection, risk profiling and compliance analytics. At the same time, transaction-level data are highly sensitive and difficult to use directly outside controlled environments. Financial institutions therefore need tools that preserve relevant behavioural information while reducing reliance on the underlying records.
A key difficulty is that financial behaviour is rarely captured by a single transaction. A single payment may be ordinary in isolation, while the distributional pattern generated by an account over time may reveal a distinctive behavioural profile. For this reason, this paper treats a bank account not as a single observation, but as a distributional object. Specifically, each account is represented through an empirical distribution over ordered transaction amount classes. This representation transforms raw transaction records into account-level financial profiles, allowing accounts to be compared in terms of their transactional behaviour rather than only through scalar summaries such as total amount, average amount or number of transactions.
In this work, amount classes are represented as ordered categories, from low-value transactions to more critical high-value transactions. This ordering matters. A reconstruction error that moves probability mass from a low-value class to an adjacent medium-value class should not be treated in the same way as an error that moves probability mass from a low-value class to the highest-value class. Standard Euclidean comparisons between histograms do not fully exploit this geometry. Wasserstein distances, which originate from optimal transport theory, provide a natural way to compare probability distributions on ordered supports because they account for both the amount of probability mass that must be moved and the distance over which it is transported.
The second key element of the proposed framework is network structure. Bank accounts are not analysed as isolated units. Instead, they are embedded in behavioural networks constructed from account-level transactional features. The central idea is that accounts with similar transactional behaviour can provide information for reconstructing hidden, missing or partially observed account-level profiles. In this setting, the network defines the channels through which distributional information is propagated. Consequently, the choice of network topology is not merely a technical detail, but an integral part of the inference procedure. We therefore compare alternative behavioural network structures, including a fully connected cosine similarity network (COS), a k-nearest-neighbour network (KNN) and a minimum spanning tree network (MST).
The remainder of the paper is organized as follows. Section “Data Profiles” describes the transactional dataset and the construction of account-level financial profiles. Section “Networks” presents the behavioural network construction and the network selection strategy. Section “Methodology” introduces the Wasserstein propagation methodology for hidden profile reconstruction. Section “Experimental Design” describes the repeated masking validation design. Section “Results” reports the empirical results. Section “Discussion” discusses the financial interpretation of the findings, while Section “Limitations” presents limitations and future research directions. Section “Conclusion” concludes.
The empirical analysis draws on the IBM Transactions for Anti-Money Laundering (AML) dataset [ibmAMLData], a publicly available synthetic transaction-level dataset developed for AML research. The data cover several types of financial transactions, including bank transfers, purchases, credit card payments, and checks. While the majority of transactions are legitimate, a smaller proportion is linked to money-laundering activity.
The primary objective of this study is not to develop a supervised AML classification model, but rather to examine whether the behavioural profile of a bank account can be represented as a probability distribution and subsequently reconstructed through network-based distributional inference. Accordingly, the analysis focuses on transaction amounts, sender and receiver accounts, payment formats, and account-level summaries of transactional behaviour.
The dataset is particularly well suited to this purpose because it contains repeated transaction records for a large number of accounts. This structure makes it possible to move beyond a transaction-level representation, in which each row corresponds to an individual payment, towards an account-level representation, in which each account is characterised by the empirical distribution of its transactional activity.
Let index sender accounts and let denote the amount of the -th outgoing transaction associated with account , with . The quantity denotes the number of observed outgoing transactions for account . Each transaction is therefore treated as an elementary observation, while the account is treated as the behavioural unit of analysis.
The raw data can be represented as a transactional table containing, at minimum, the following fields: sender account identifier, receiver account identifier, transaction amount and payment format. Starting from this table, we construct account-level summaries and empirical amount distributions. This transformation is necessary because the subsequent network construction and propagation procedure operate at the account level rather than at the individual transaction level.
The preprocessing pipeline is designed to ensure that account-level behavioural profiles are based on sufficiently reliable transactional information. Transaction amounts are converted into numerical values, and observations with missing or non-positive amounts are removed, as they do not provide meaningful information for constructing amount-based behavioural distributions. Sender accounts with fewer than five recorded transactions are also excluded, since empirical distributions estimated from very limited activity may be unstable and overly influenced by random variation.
The five-transaction threshold represents a pragmatic compromise between estimation reliability and sample size. It removes accounts whose behavioural distributions would be poorly estimated while preserving a sufficiently large number of observations for network construction and validation. Following this filtering procedure, the remaining transactions are aggregated at the account level to derive behavioural summaries and empirical financial profiles, which are subsequently used to construct the behavioural similarity networks.
| Quantity | Value |
|---|---|
| Transactions after preprocessing | 5,078,345 |
| Sender accounts before minimum-activity filtering | 984,625 |
| Receiver accounts | 420,640 |
| Sender accounts after minimum-activity filtering | 231,633 |
| Selected sender accounts for network experiment | 1,000 |
| Minimum transactions per retained sender account | 5 |
| Amount classes | 4 |
| Behavioural features used for network construction | 11 |
To represent account-level transactional behaviour in distributional form, transaction amounts are discretized into four ordered classes. The classes are constructed using the global empirical quartiles of the transaction amount distribution. Let denote the collection of all positive transaction amounts in the filtered dataset. We define the thresholds:
where denotes the empirical -quantile of the global transaction amount distribution. These thresholds define four ordered amount classes:
The four classes are labelled Low, Medium, High, and Critical. Their boundaries are defined using global quartiles so that all accounts are represented on a common monetary scale. This ensures that the resulting behavioural distributions remain directly comparable across accounts. By contrast, account-specific thresholds would make the class labels inconsistent, as the same category could correspond to different transaction amount ranges for different accounts, thereby weakening the interpretation of cross-account distances.
The ordering of the four classes is an essential feature of the proposed framework. Rather than representing unrelated categories, they capture progressively higher levels of transaction amount. As a result, the difference between Low and Medium is naturally smaller than the difference between Low and Critical. This ordinal structure provides a clear motivation for using the Wasserstein distance during the reconstruction stage, since it accounts not only for differences in probability mass but also for the distance over which that mass must be moved across the ordered support.
For each account , we construct an empirical probability distribution over the four amount classes. Let denote the proportion of transactions of account falling in class , for . Formally,
where is the indicator function. The account-level financial profile is then defined as
where denotes the probability simplex in four dimensions. By construction,
Thus, each account is represented as a distributional object rather than as a vector of unrelated summary statistics. This representation captures the relative intensity of an account's activity across different transaction amount ranges. For example, one account may be concentrated almost entirely in the Low class, while another may allocate a substantial fraction of its transactions to the High or Critical classes. These differences are financially meaningful, since they describe heterogeneous transactional behaviours at the account level.
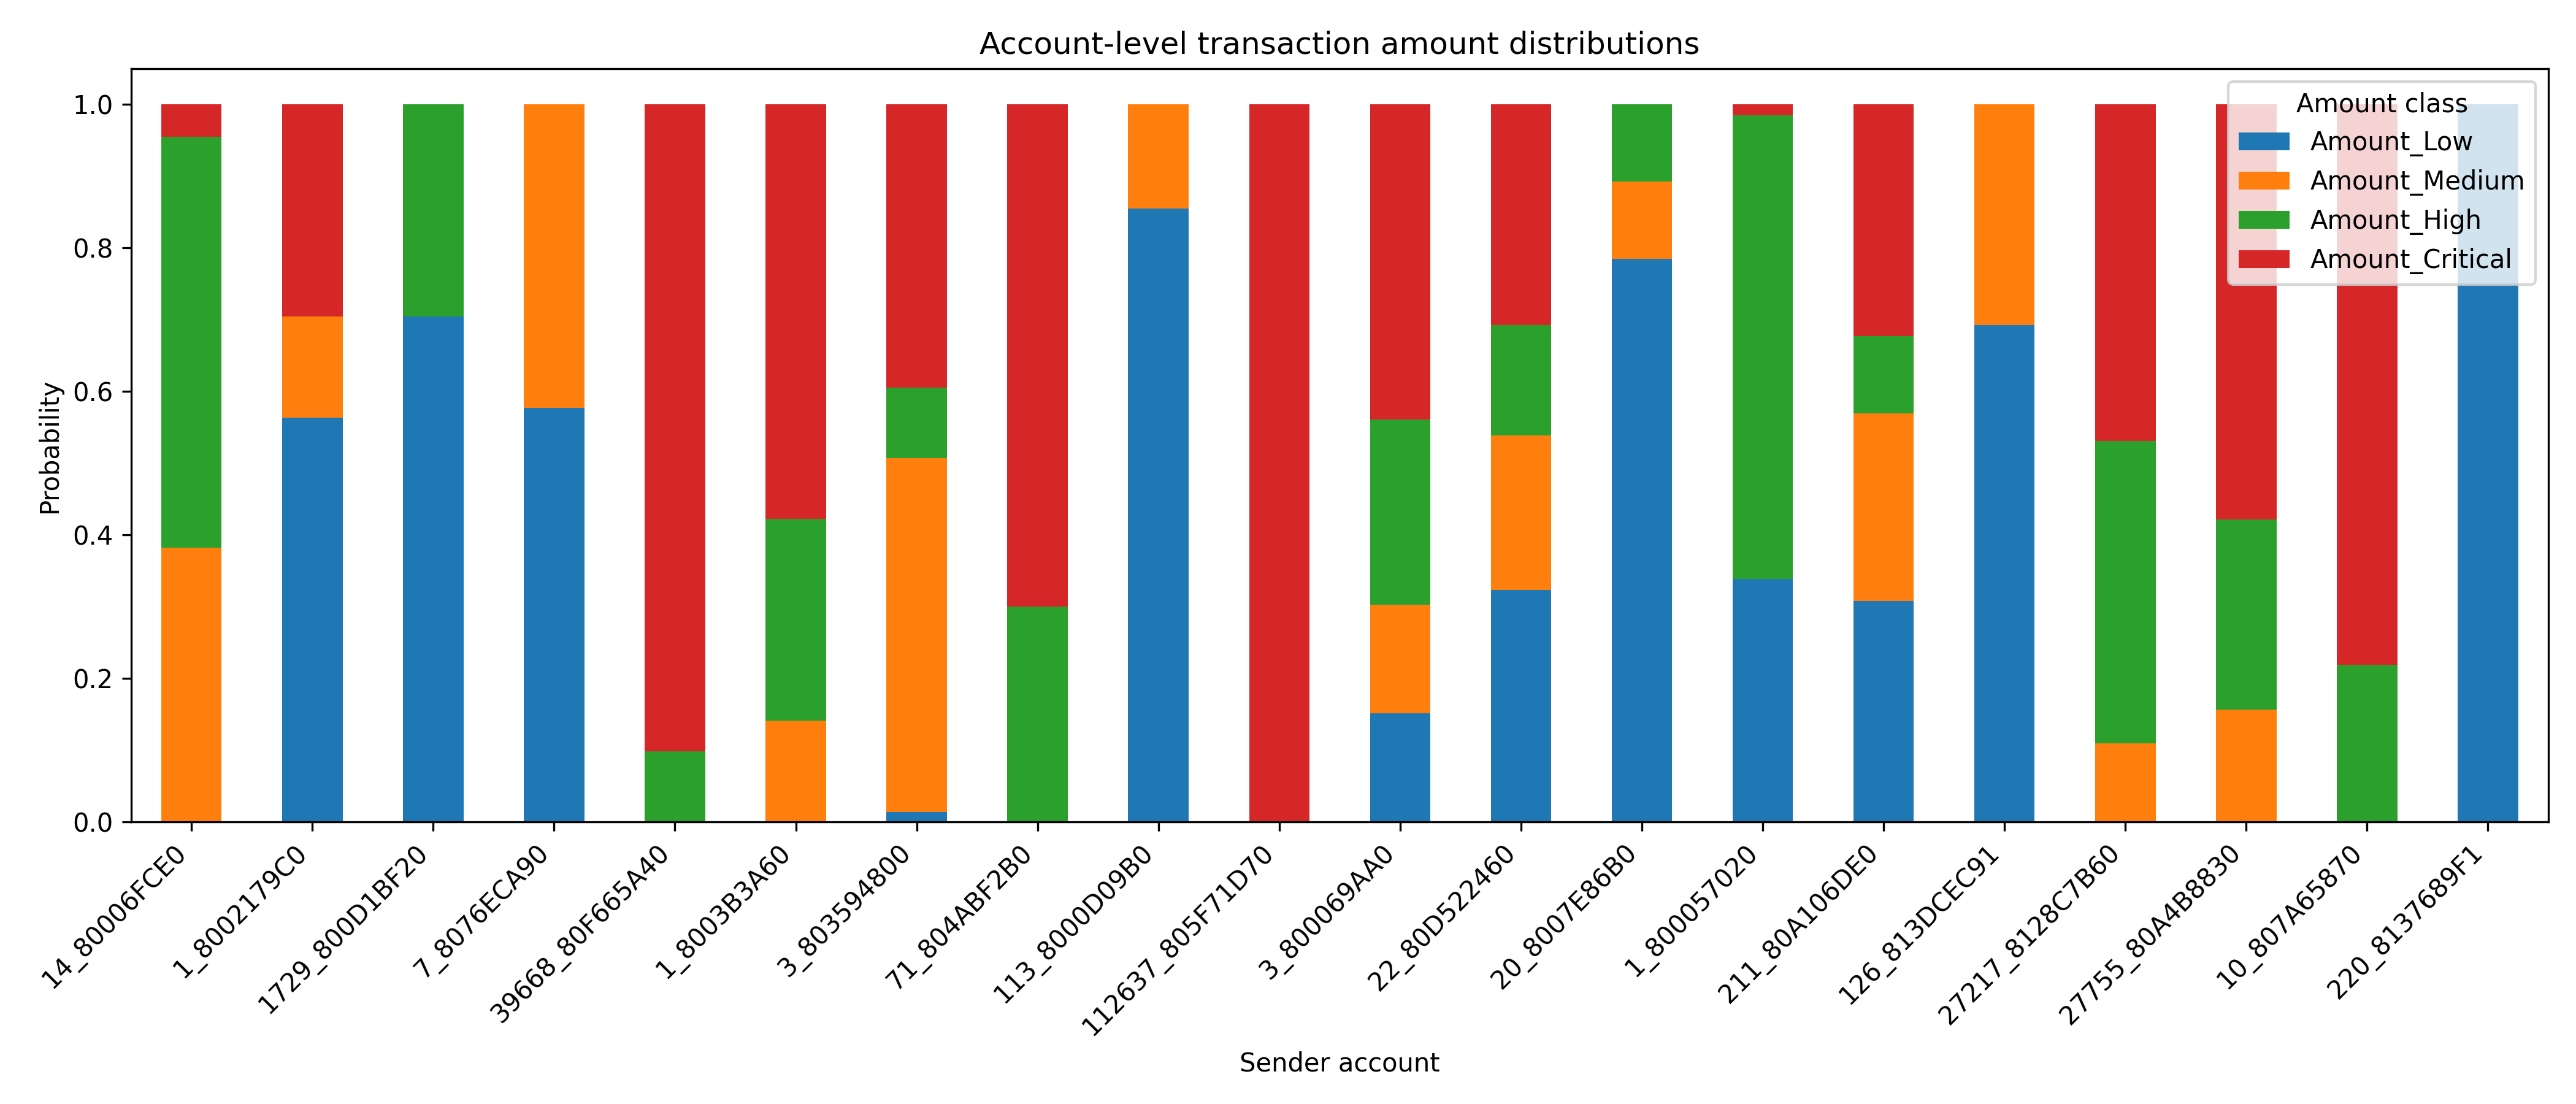
Figure “Account Distributions” illustrates this representation for the 20 sender accounts with the largest number of observed transactions. Accounts are ordered according to their transaction count in decreasing order. Each stacked bar corresponds to one sender account and reports the proportion of its transactions falling into the four ordered amount classes. The figure is intended to illustrate the heterogeneity of account-level financial profiles, rather than to display the full set of accounts used in the network reconstruction experiment.
In addition to the amount-class distribution, we compute a set of account-level behavioural features used to construct the banking similarity networks. These features include the number of transactions, total transaction amount, mean amount, median amount, standard deviation of transaction amounts, number of unique receiving accounts and number of unique payment formats. The four amount-class proportions are also included among the behavioural features.
Because several of these variables are highly skewed, strictly positive aggregate variables are log-transformed before standardization. The resulting feature matrix is then standardized to ensure that variables measured on different scales contribute comparably to the construction of account similarities. Let denote the standardized behavioural feature vector of account . These vectors form the basis for the network construction procedure described in Section “Networks”.
After constructing account-level financial profiles, we define behavioural networks among bank accounts. The purpose of these networks is to encode similarities between accounts and to provide the relational structure through which distributional information is propagated. In this framework, each node represents a sender account, while edges represent behavioural proximity between accounts.
For each account , let denote the vector of behavioural features used for network construction. In the empirical implementation, this vector includes aggregate transactional features such as transaction count, total amount, mean amount, median amount, standard deviation of transaction amounts, number of unique receivers and number of unique payment formats. The vector also includes the four account-level amount-class proportions introduced in Section “Data Profiles”. Therefore, the network is not constructed only from transaction volume or average transaction size, but from a broader behavioural representation of account activity.
Several account-level variables are highly skewed, especially transaction counts and monetary aggregates. To reduce the influence of extreme values, these variables are log-transformed before standardization. All features are then standardized so that variables measured on different scales contribute comparably to the similarity computation. The resulting standardized feature vector for account is denoted by .
The choice of the network topology is an important component of the methodology. Different network constructions encode different assumptions about how behavioural information should flow between accounts. A dense network allows information to be propagated globally across many accounts, while a sparse network restricts propagation to more selective behavioural relationships. For this reason, we compare alternative network structures rather than assuming a single graph construction.
The first network is based on cosine similarity between standardized behavioural feature vectors. For two accounts and , cosine similarity is defined as
where denotes the Euclidean inner product and denotes the Euclidean norm. The corresponding cosine distance is defined as
Small values of indicate accounts with similar behavioural profiles, while larger values indicate more dissimilar accounts. The cosine similarity network is constructed as a fully connected weighted graph. Its edge weights are obtained by transforming distances into similarities according to
where is a small numerical constant introduced to avoid division by zero. Extremely large weights are capped at a high empirical quantile to improve numerical stability. This network provides a dense benchmark in which every account is allowed to contribute, with different intensity, to the propagation mechanism.
The second network is a k-nearest-neighbour (KNN) graph. While the cosine network is fully connected, the KNN network keeps only local behavioural relationships. For each account , let denote the set of its nearest neighbours according to the cosine distance . Formally,
The KNN graph is symmetrized by adding an undirected edge between accounts and whenever either or . Thus,
The weight of each retained edge is again defined as . In the empirical analysis, we set . This network represents a local behavioural topology: each account is reconstructed primarily from accounts with closely related transaction patterns.
The third network is the minimum spanning tree (MST). Starting from the cosine distance matrix , the MST selects the set of edges that connects all accounts while minimizing the total distance. Formally, among all connected trees over the set of accounts , the MST solves
If accounts are included, the MST contains exactly edges. It therefore provides the sparsest connected behavioural backbone of the account system. Unlike the fully connected cosine network, the MST strongly restricts the propagation channels. Unlike the KNN network, it guarantees global connectivity while retaining only the most essential edges required to connect all accounts.
From a financial perspective, the MST can be interpreted as a parsimonious behavioural skeleton of the banking system. It removes redundant similarity links and preserves only a minimal structure of account proximity. However, this parsimony may also be a limitation: some local relationships that are useful for reconstruction may be excluded.
The reconstruction performance of Wasserstein propagation depends on the network used as propagation channel. A network that is too dense may over-smooth account-level profiles by mixing information from many accounts, including weakly related ones. Conversely, a network that is too sparse may fail to provide enough local information for accurate reconstruction. The network selection step evaluates this trade-off empirically.
Let denote a candidate behavioural network, where , is the set of selected accounts, is the edge set and is the corresponding weighted adjacency matrix. Each candidate network is used as a propagation structure in the reconstruction experiment described in Section “Methodology”. The networks are then compared using the Wasserstein reconstruction error between the true and reconstructed account-level distributions.
This network selection procedure is motivated by the fact that network topology is not neutral in distributional propagation problems. The graph determines which accounts exchange information, how local or global the reconstruction is and how strongly each neighbouring profile contributes to the inferred distribution. Similar ideas have been explored in network-based distributional inference settings, where different graph structures can lead to different propagation accuracy [spelta2026cyberrisk]. In the present paper, this principle is adapted to banking transaction data and evaluated in terms of account-level financial profile reconstruction.
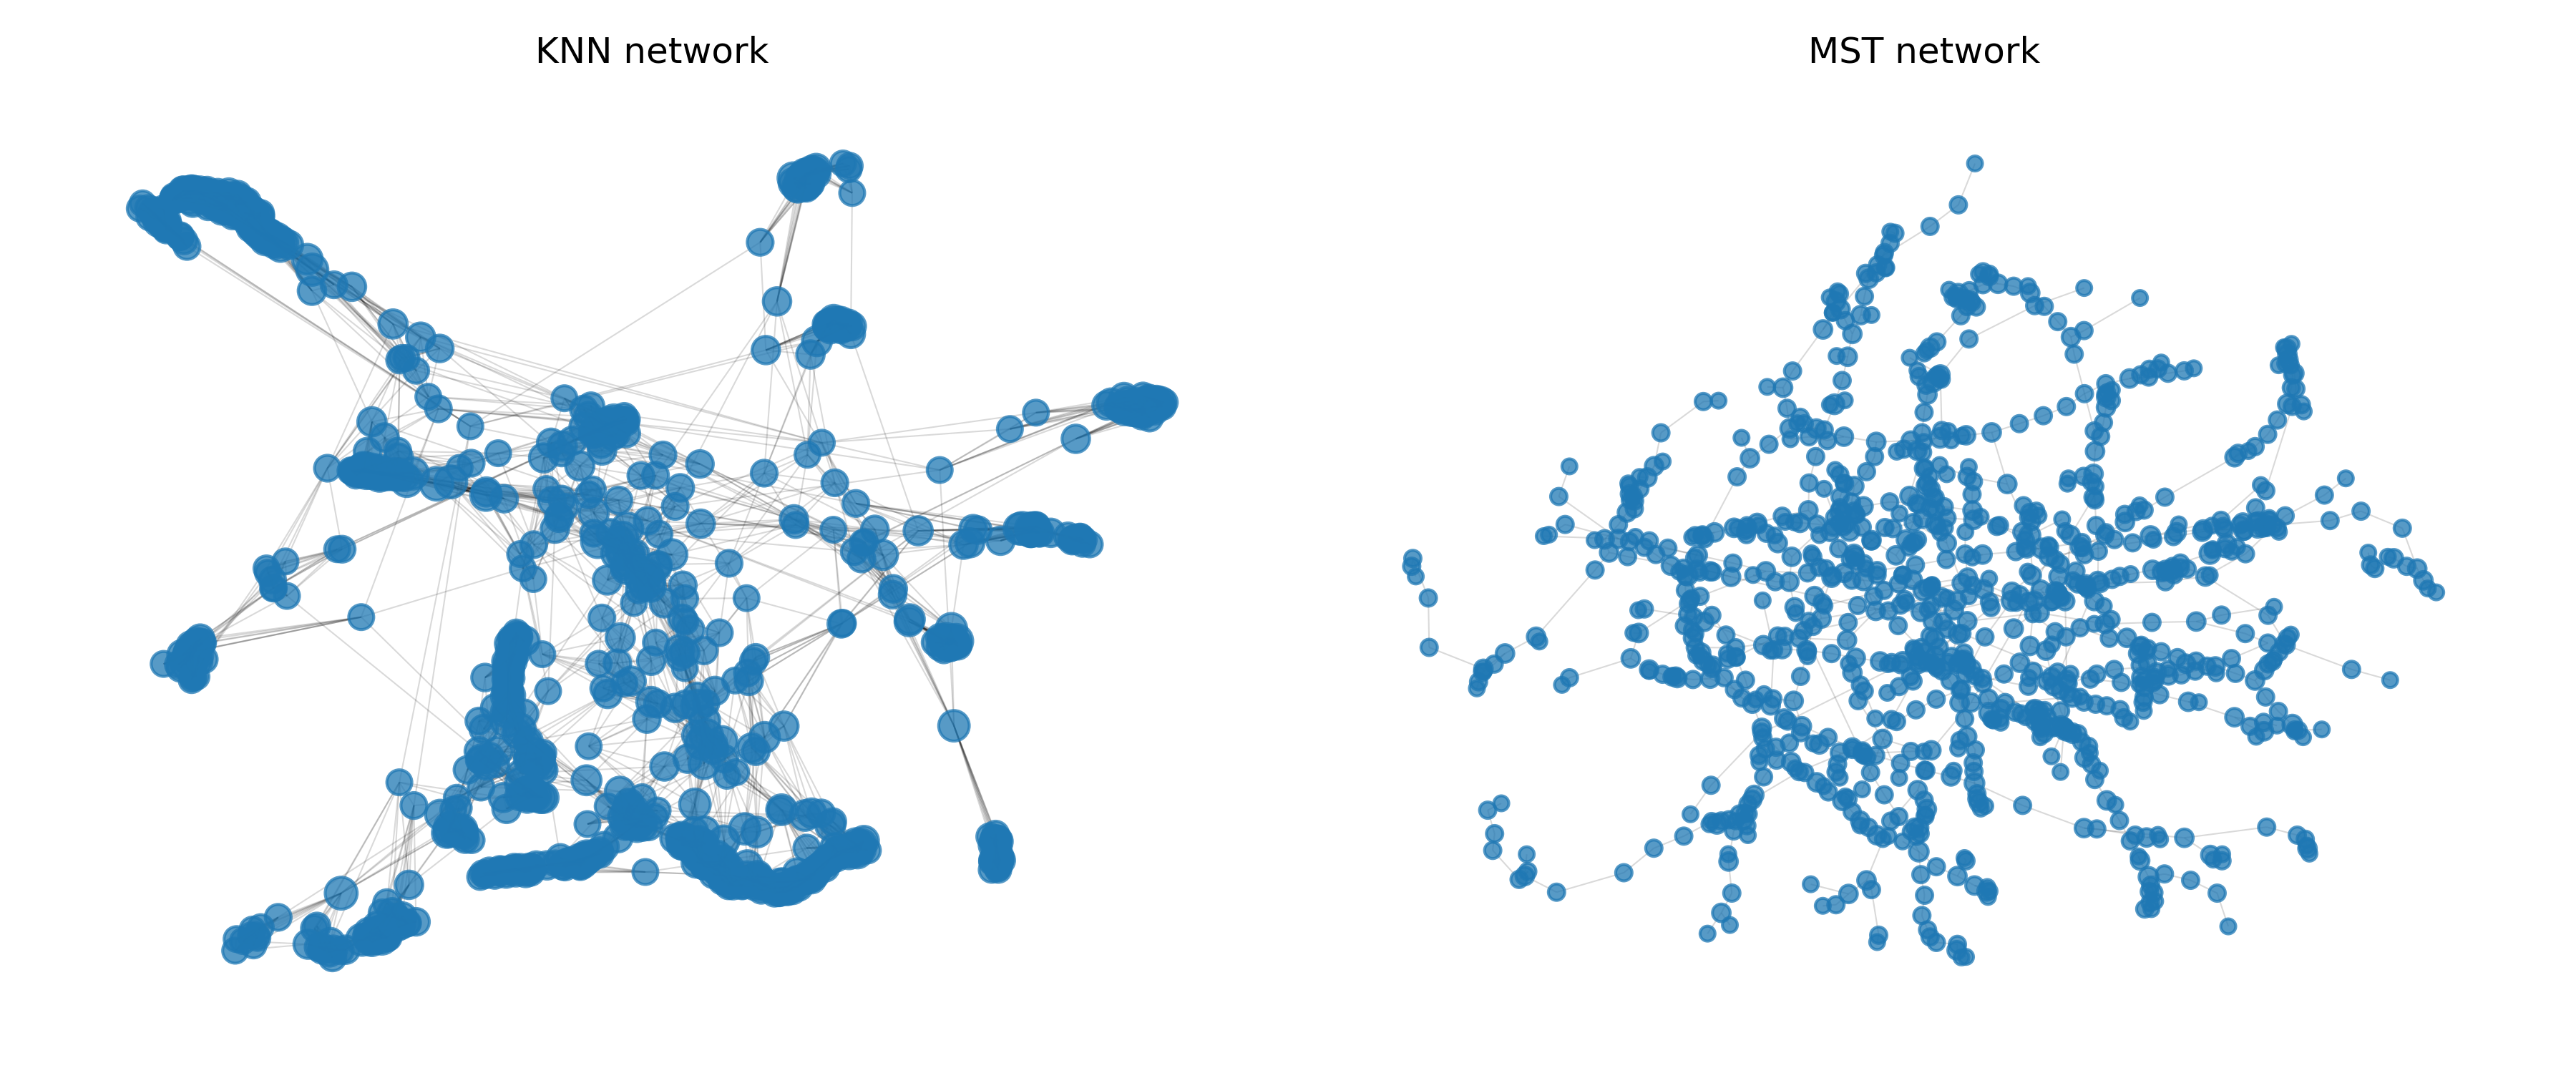
Before evaluating reconstruction accuracy, we compare the structural properties of the candidate networks. The comparison includes the number of nodes, number of edges, network density, number of connected components, size of the largest connected component, average degree, average weighted degree, clustering coefficient, diameter and average path length of the largest connected component.
These structural metrics provide a descriptive view of the propagation channels. The cosine similarity network is expected to be the densest topology, since it connects all pairs of accounts. The MST is expected to be the sparsest connected topology, with exactly edges. The KNN network lies between these two extremes, preserving local behavioural neighbourhoods while remaining substantially sparser than the fully connected cosine network.
| Network | Nodes | Edges | Density | Components | LCC size | Avg. degree | Avg. weighted degree | Clustering | Diameter | Avg. path length |
|---|---|---|---|---|---|---|---|---|---|---|
| COS | 1000 | 499500 | 1.0000 | 1 | 1000 | 999.000 | 8097.3612 | 1.0000 | 1 | 1.000 |
| KNN | 1000 | 6534 | 0.0131 | 3 | 922 | 13.068 | 2336.1208 | 0.6517 | 16 | 6.704 |
| MST | 1000 | 999 | 0.0020 | 1 | 1000 | 1.998 | 462.0061 | 0.0000 | 175 | 62.645 |
Table “Network Metrics” highlights the different structural assumptions encoded by the three candidate networks. The COS network is fully connected, with all pairs of accounts linked and density equal to one. This provides the most global propagation structure, but also the least selective one. The KNN network is substantially sparser, with 6,534 edges and density equal to 0.0131. It preserves local behavioural neighbourhoods, although it produces three connected components and a largest connected component of 922 accounts. The MST network is the sparsest connected topology, with exactly 999 edges for 1,000 accounts. Its zero clustering coefficient, large diameter and high average path length reflect its tree structure and indicate that information propagation is forced through a minimal behavioural backbone.
These differences motivate the empirical network selection step. The fully connected COS network may exploit a large amount of information but may also over-smooth account profiles. The KNN network restricts propagation to local behavioural neighbours, while the MST network provides a connected but highly constrained topology. The reconstruction experiment therefore evaluates whether denser or sparser behavioural networks provide more accurate account-level distributional reconstruction.
Let denote a weighted behavioural banking network, where is the set of sender accounts, is the set of edges and is the weighted adjacency matrix. Each node is associated with an account-level financial profile
where the four components correspond to the empirical probabilities of observing transactions in the Low, Medium, High and Critical amount classes. The objective is to reconstruct the profile for accounts whose distribution is treated as hidden, using the observed profiles of other accounts and the behavioural relationships encoded by the graph.
Let denote the set of accounts with observed profiles and let denote the set of hidden accounts. For , the profile is observed and remains fixed during propagation. For , the goal is to estimate an unknown distribution using the profiles of neighbouring accounts. The reconstruction problem is therefore semi-supervised at the account level: only a subset of node distributions is assumed to be known, and the missing distributions are inferred through the network structure.
The four amount classes are ordered. We associate them with the one-dimensional support
corresponding respectively to Low, Medium, High and Critical. This ordered support is essential because it encodes the fact that moving probability mass from Low to Medium is less severe than moving it from Low to Critical.
Given two account-level distributions , the Wasserstein distance measures the minimum cost required to transform into . More generally, for two discrete probability distributions supported on , the optimal transport problem can be written as
where is a transport plan, is the set of admissible transport plans with marginals and , and is the cost of moving probability mass from support point to support point . In our setting, the support is one-dimensional and ordered, so Wasserstein geometry provides a natural way to compare transaction amount distributions [villani2008optimal; peyre2019computational].
For evaluation, we use the one-dimensional Wasserstein-1 distance. Since all account profiles are defined on the same ordered support, this distance can be computed through cumulative distribution functions. Let
Then
In the present case, and . This formulation makes the reconstruction error directly interpretable as the amount of probability mass that must be shifted across adjacent ordered transaction classes.
For a hidden account , reconstruction is performed by combining information from its neighbours in the behavioural network. Let
denote the set of neighbours of account . The estimated profile of is obtained as a weighted Wasserstein barycentre of the neighbouring profiles:
where are normalized edge weights,
The Wasserstein barycentre is the distribution that minimizes the weighted sum of Wasserstein distances from the input distributions. Formally,
This operation differs from a standard Euclidean average of histograms. A Euclidean average combines probability values component by component, without explicitly accounting for the ordering of the support. A Wasserstein barycentre instead averages distributions according to the geometry of the underlying amount classes, preserving the interpretation of probability mass movement across ordered financial categories.
The empirical profiles considered in this paper are defined on a one-dimensional ordered support with only four classes. This allows us to compute a fast Wasserstein barycentric approximation without solving a high-dimensional optimal transport problem at every propagation step. In one dimension, Wasserstein barycentres can be represented through averages of quantile functions. Therefore, for each set of neighbouring distributions, we approximate the barycentre by averaging their empirical quantile functions using the normalized network weights and then projecting the resulting distribution back onto the four ordered amount classes.
This approximation is computationally convenient and coherent with the geometry of the problem. It exploits the fact that the amount classes are ordered and avoids repeated Sinkhorn iterations for each hidden node and each propagation step. Entropic optimal transport and Sinkhorn-based barycentres provide a general computational framework for optimal transport problems [cuturi2013sinkhorn], but in the present application the one-dimensional ordered structure permits a faster and more direct implementation.
The reconstruction is performed iteratively. Observed account profiles remain fixed throughout the procedure:
Hidden profiles are initialized using the average observed distribution:
At each iteration , each hidden profile is updated as the Wasserstein barycentric combination of its neighbours' current profiles:
If a hidden node has no available neighbours in the propagation graph, its profile is assigned the global observed distribution. In the empirical implementation, for numerical stability and computational efficiency, the barycentric update uses the strongest neighbouring weights up to a fixed maximum number of neighbours. This is particularly useful for dense networks, where using all possible neighbours may increase computational cost and reduce the locality of the reconstruction.
The iterative process stops when the change between two successive matrices of reconstructed profiles falls below a fixed tolerance or when a maximum number of iterations is reached. Let denote the matrix of reconstructed profiles at iteration . The stopping rule is based on
where denotes the Frobenius norm and is a convergence tolerance.
For each hidden account , reconstruction accuracy is evaluated by comparing the true profile with the reconstructed profile . The account-level reconstruction error is defined as
Low values of indicate that the reconstructed distribution is close to the true financial profile. Higher values indicate that the account's transactional behaviour is not well explained by the profiles propagated through its behavioural neighbourhood.
For each replication of the masking experiment, we summarize reconstruction accuracy using the mean Wasserstein error,
and the median Wasserstein error,
The mean error measures the average reconstruction discrepancy, while the median error is more robust to a small number of difficult accounts with large reconstruction errors. Both quantities are reported in the empirical results, together with upper quantiles and maximum observed errors.
The empirical validation is designed to assess whether account-level financial profiles can be reconstructed from behavioural network information. The experiment follows a masking strategy: a subset of account-level distributions is temporarily treated as unobserved, reconstructed through Wasserstein propagation and then compared with the true distributions. This design allows us to evaluate the reconstruction capability of the proposed framework under controlled missing-profile scenarios.
The validation does not aim to predict individual transactions. Instead, the target is the account-level distribution
where the four components represent the proportions of transactions falling into the ordered amount classes Low, Medium, High and Critical. Therefore, the experiment evaluates whether the network structure preserves enough behavioural information to recover distributional financial profiles.
The reconstruction experiment is performed on a subset of sender accounts. These accounts are selected from the preprocessed account-level dataset by sorting accounts in decreasing order of transaction count and retaining the most active accounts. This choice has two motivations. First, accounts with more transactions provide more stable empirical distributions. Second, restricting the reconstruction experiment to a fixed subset of active accounts reduces computational cost while maintaining a sufficiently large network for empirical evaluation.
Let denote the selected set of accounts, with . For each account , the true account-level distribution is available before masking. These true profiles are used only for evaluation for accounts assigned to the hidden set.
For each candidate network, we evaluate reconstruction accuracy under three levels of missingness:
For a given missing fraction , a subset of accounts is randomly selected and treated as hidden. The corresponding observed set is
The profiles of accounts in remain fixed during propagation, while the profiles of accounts in are reconstructed using the procedure described in Section “Methodology”. The number of hidden accounts is therefore
Since , the three masking scenarios correspond to approximately , and hidden account profiles, respectively.
For each missing fraction, the masking experiment is repeated times. Each replication uses a different random subset of hidden accounts. Repeated masking reduces the dependence of the results on a single random split and provides a more stable assessment of reconstruction performance.
A key feature of the experimental design is that the same masking splits are used for all candidate networks. This ensures a fair comparison between network structures. In other words, the cosine similarity network, the KNN network and the MST network are evaluated on exactly the same hidden accounts in each replication. Differences in reconstruction performance can therefore be attributed to the network topology rather than to different random masking configurations.
Formally, let denote the hidden set for missing fraction and replication , with
For every candidate network , where , the reconstruction procedure is evaluated on the same family of hidden sets .
The experiment compares three behavioural banking networks. The first is the fully connected cosine similarity network, denoted by COS. This network provides a dense benchmark in which all selected accounts are connected through weighted similarities. The second is the symmetrized K-nearest-neighbour network, denoted by KNN, with . This network restricts propagation to local behavioural neighbourhoods. The third is the minimum spanning tree network, denoted by MST, which provides the sparsest connected behavioural backbone.
Each network defines a different propagation structure. The COS network emphasizes global information sharing, the KNN network emphasizes local similarity and the MST network emphasizes parsimonious connectivity. Comparing these networks allows us to evaluate whether dense, local or minimally connected behavioural structures are more effective for account-level profile reconstruction.
The propagation algorithm is implemented as an iterative Wasserstein barycentric reconstruction procedure. Hidden profiles are initialized using the average observed distribution and updated using barycentric combinations of neighbouring profiles. Observed profiles are kept fixed throughout the iterations.
In the empirical implementation, the maximum number of propagation iterations is set to , and the convergence tolerance is set to . For computational efficiency and numerical stability, the barycentric update uses at most the strongest neighbouring weights for each hidden node. This restriction is particularly relevant for dense networks such as COS, where using all neighbours would be computationally expensive and could reduce the locality of the reconstruction.
The main computational settings are summarized in Table “Experimental Design”.
| Setting | Value | |
|---|---|---|
| Selected sender accounts | 1,000 | |
| Missing fractions | 10\ Replications per missing fraction | 20 |
| Candidate networks | COS, KNN, MST | |
| KNN parameter | K=10 | |
| Maximum propagation iterations | 50 | |
| Convergence tolerance | 10^-6 | |
| Maximum neighbours used in barycentric update | 30 | |
| Reconstruction metric | Wasserstein-1 distance |
For each hidden account , reconstruction accuracy is measured by the Wasserstein-1 distance between the true account-level profile and the reconstructed profile :
For each network, missing fraction and replication, the distribution of errors is summarized through the mean, median, upper quartile and maximum Wasserstein error. The mean error measures the average reconstruction discrepancy, while the median error provides a robust measure of typical reconstruction performance. The upper quartile and maximum error are useful for identifying difficult cases, namely accounts whose financial profile is weakly reconstructed from the surrounding behavioural network.
The empirical results in Section “Results” compare the candidate networks using both graphical summaries and numerical tables. In particular, boxplots are used to compare the distribution of reconstruction errors across networks, while summary tables report the main error statistics for each missing fraction.
This section reports the empirical results of the repeated masking experiment described in Section “Experimental Design”. For each candidate behavioural network, account-level financial profiles are partially hidden, reconstructed through Wasserstein propagation and compared with their true empirical distributions. Reconstruction accuracy is evaluated using the Wasserstein-1 distance between true and reconstructed profiles.
The analysis compares three candidate network structures: the fully connected cosine similarity network (COS), the symmetrized k-nearest-neighbour network (KNN) and the minimum spanning tree network (MST). For each network, the experiment is repeated across three missing fractions, , and , with 20 independent replications for each missingness level. The same masking splits are used across networks, ensuring that differences in reconstruction performance are attributable to the propagation structure rather than to different hidden-account samples.
We first compare reconstruction performance at a fixed missing fraction. Figure “Network Selection Boxplot” reports the distribution of Wasserstein reconstruction errors across the candidate networks when 20% of account profiles are treated as hidden. Each boxplot summarizes the account-level reconstruction errors obtained across repeated masking replications.
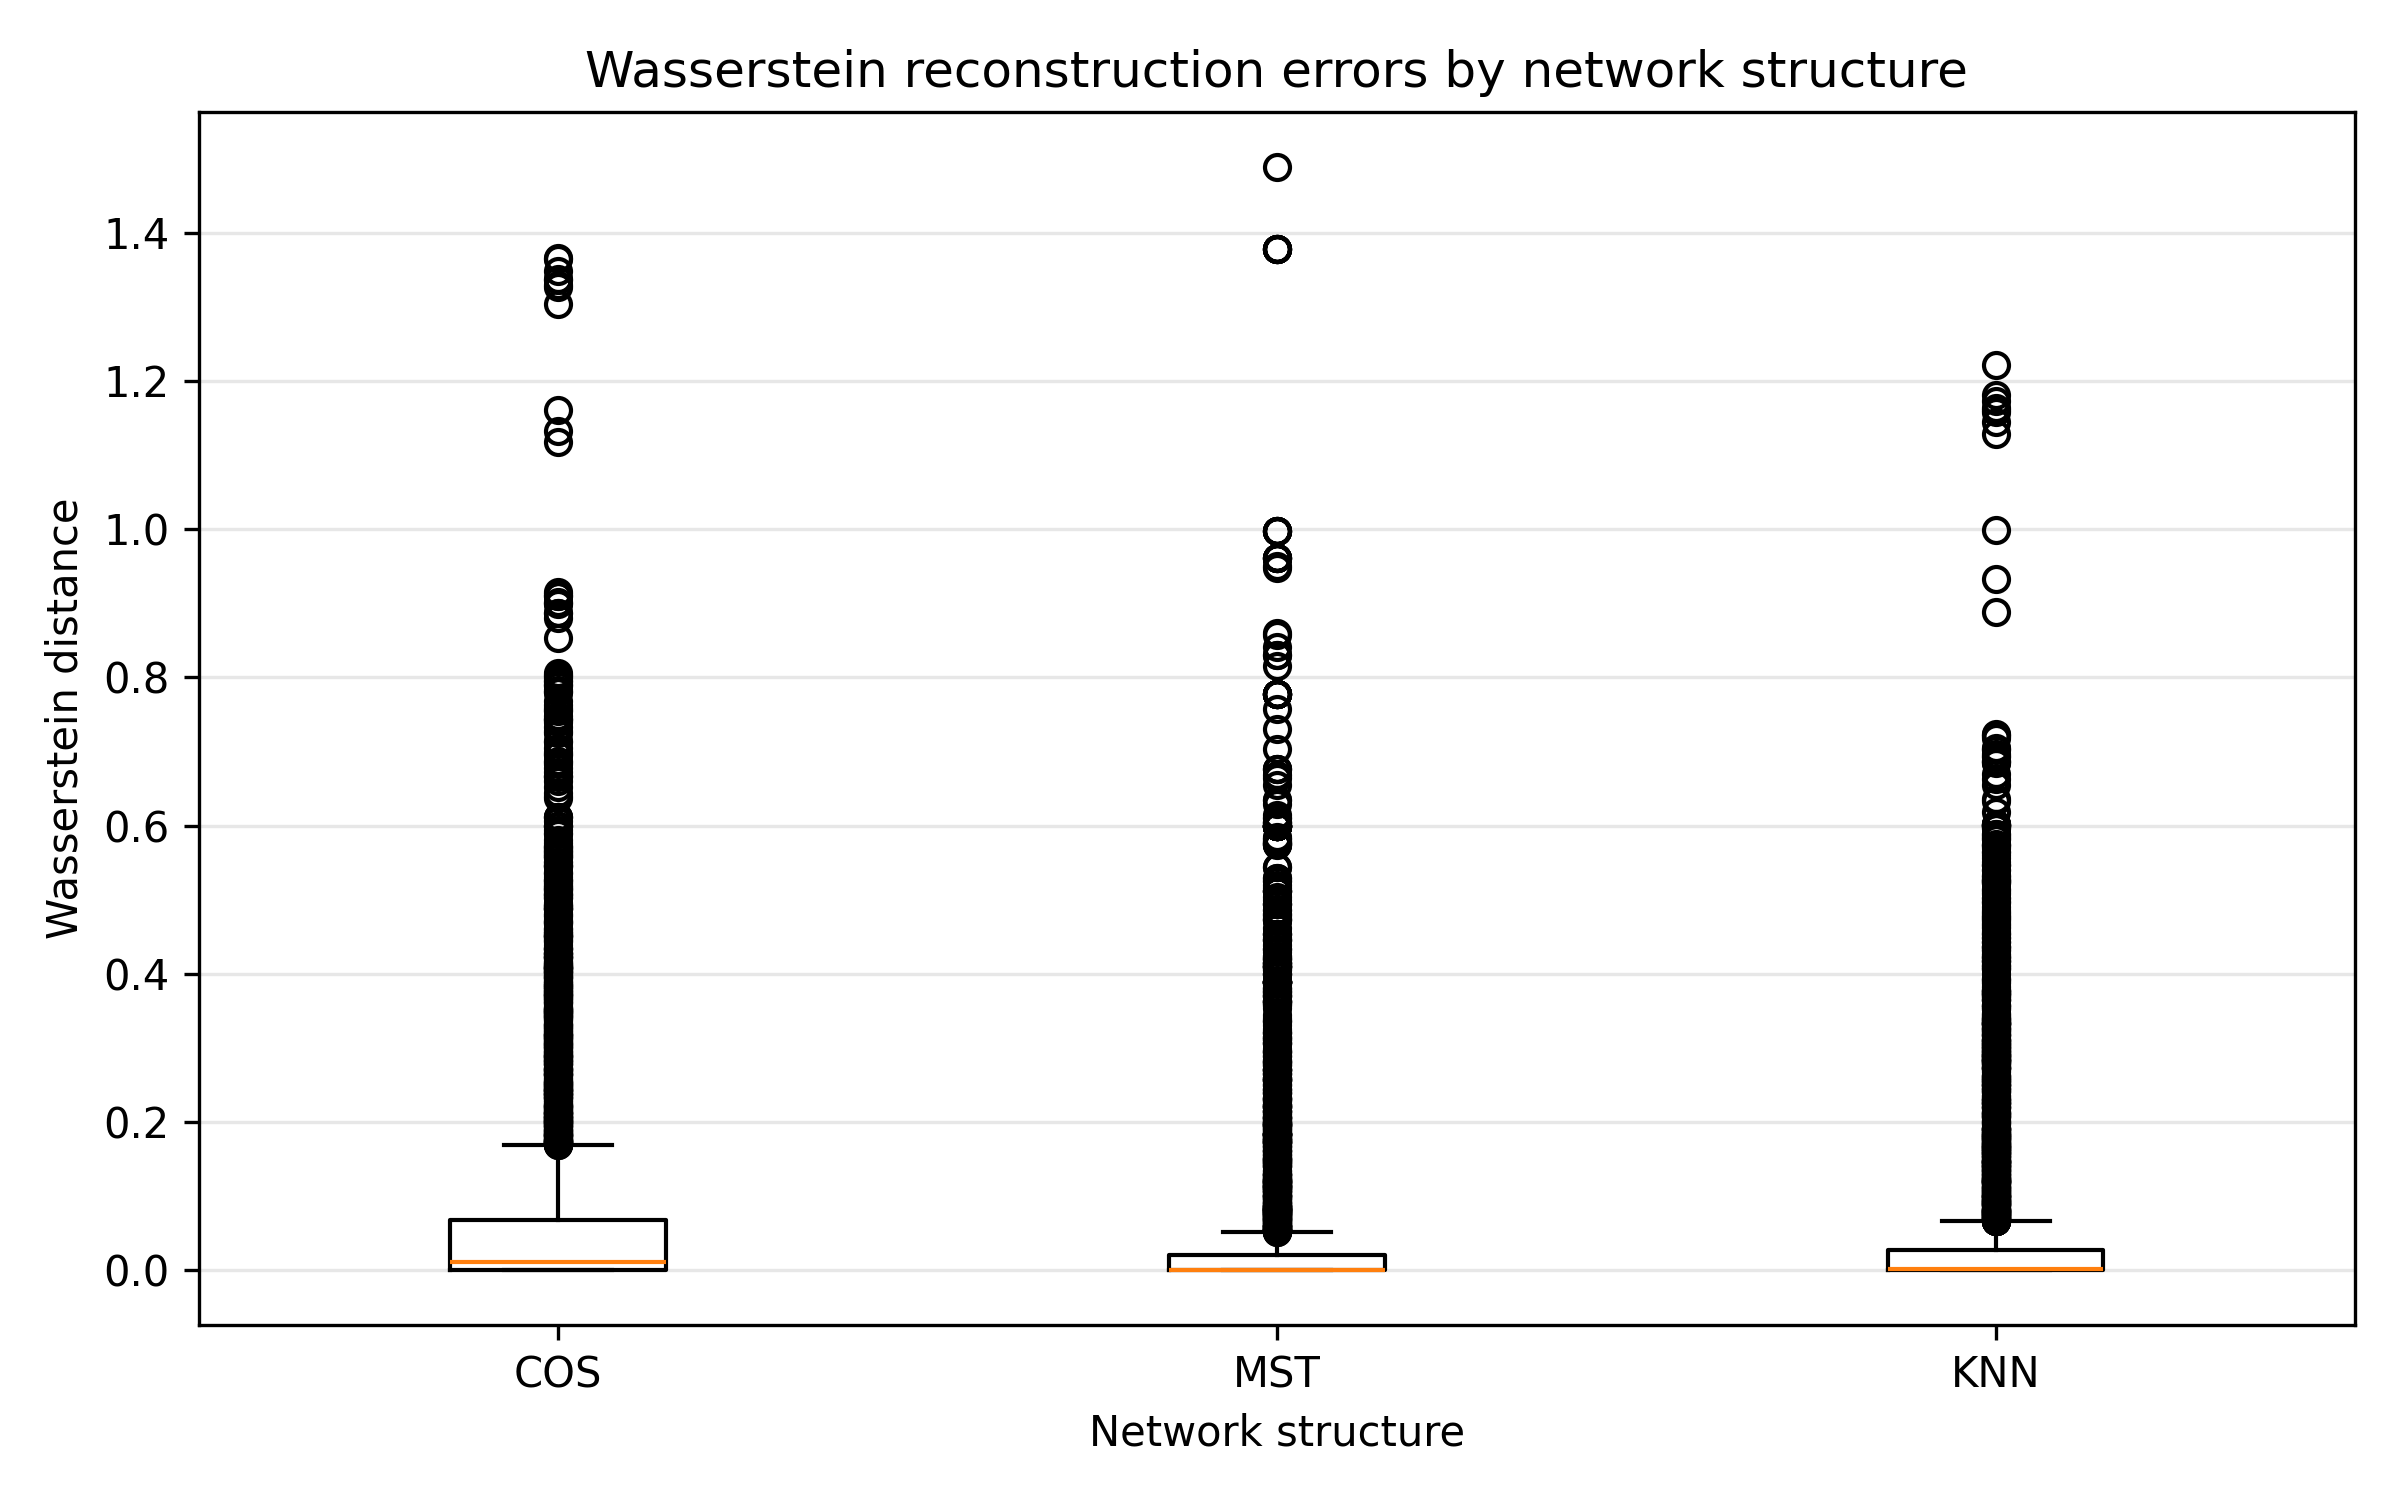
The comparison in Figure “Network Selection Boxplot” provides a direct assessment of how the network topology affects reconstruction quality. A network that produces lower and less dispersed Wasserstein errors is better able to propagate information from observed accounts to hidden accounts. Conversely, larger errors indicate that the hidden financial profiles are less accurately reconstructed from neighbouring behavioural information.
The COS network provides a dense propagation benchmark, since every account is connected to all other accounts through similarity weights. The KNN network restricts propagation to local behavioural neighbourhoods, while the MST network propagates information along a minimal connected backbone. The relative position and dispersion of the boxplots therefore indicate whether dense, local or minimally connected network structures are more effective for account-level distributional reconstruction.
Figure “Network Selection Robustness” reports reconstruction performance across the three missing fractions considered in the validation experiment. This robustness analysis evaluates whether the relative performance of the candidate networks remains stable as the proportion of hidden profiles increases.
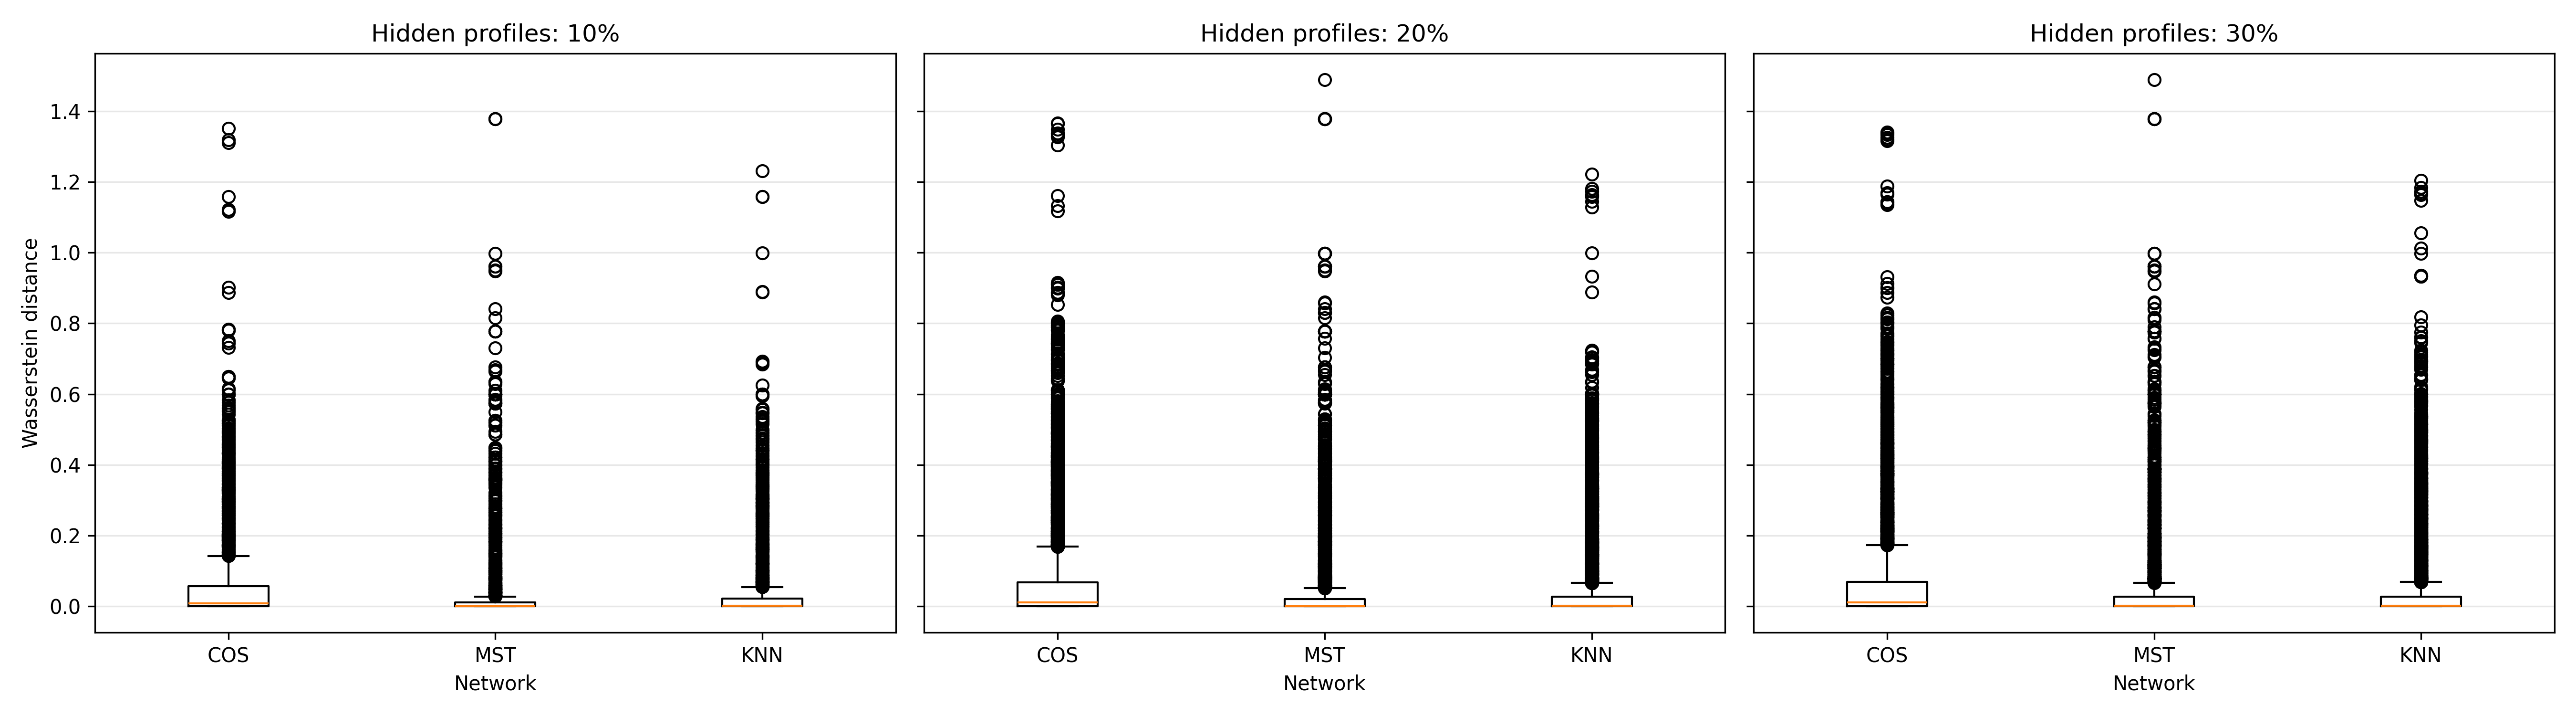
As the missing fraction increases, the reconstruction problem becomes more difficult because fewer account-level profiles are available as fixed sources of information. A robust network should maintain relatively low reconstruction errors even when the proportion of hidden accounts increases. The comparison across missing fractions therefore provides evidence on the stability of the propagation mechanism under different levels of missing information.
Table “Reconstruction Summary” reports the numerical summary of reconstruction performance by network and missing fraction. For each configuration, the table reports the mean and median Wasserstein error across repeated masking experiments. The mean error captures the average reconstruction discrepancy, while the median error provides a robust measure of typical performance.
| Network | Missing fraction | Profiles | Mean error | Median error | Q75 error | Max error | |||
|---|---|---|---|---|---|---|---|---|---|
| COS | 10\ COS | 20\ COS | 30\ KNN | 10\ KNN | 20\ KNN | 30\ MST | 10\ MST | 20\ MST | 30\ |
The numerical results in Table “Reconstruction Summary” show that the sparse networks outperform the fully connected cosine similarity network in terms of average Wasserstein reconstruction error. Across all missing fractions, COS produces the largest mean errors, ranging from 0.0714 to 0.0775. KNN improves the reconstruction accuracy, with mean errors between 0.0505 and 0.0541. MST obtains the lowest mean error at 10% missingness and remains very close to KNN at 20% and 30% missingness.
The median errors are substantially smaller than the mean errors for all networks, indicating that most hidden profiles are reconstructed accurately, while a limited number of accounts generate large reconstruction errors. This is also reflected in the maximum errors, which are above one for all network structures. The difference between mean and median error suggests that reconstruction difficulty is concentrated in a minority of atypical or weakly connected financial profiles.
The results also indicate that the reconstruction performance is relatively stable as the missing fraction increases from 10% to 30%. For KNN and MST, the mean error remains close to 0.05 across all missingness levels. This suggests that local and sparse behavioural networks preserve sufficient information to reconstruct hidden account-level distributions even when a larger fraction of profiles is masked.
The aggregate reconstruction errors reported above quantify the average performance of each behavioural network. However, they do not directly show how the reconstructed financial profiles differ from the true account-level distributions. For this reason, we inspect representative true and reconstructed profiles for the best-performing network under the central missingness scenario, corresponding to 20% hidden account profiles.
The representative replication is selected as the one whose mean Wasserstein reconstruction error is closest to the median replication-level mean error across the 20 replications. Within this replication, we display three hidden accounts: the account with the lowest reconstruction error, the account with median reconstruction error and the account with the highest reconstruction error.
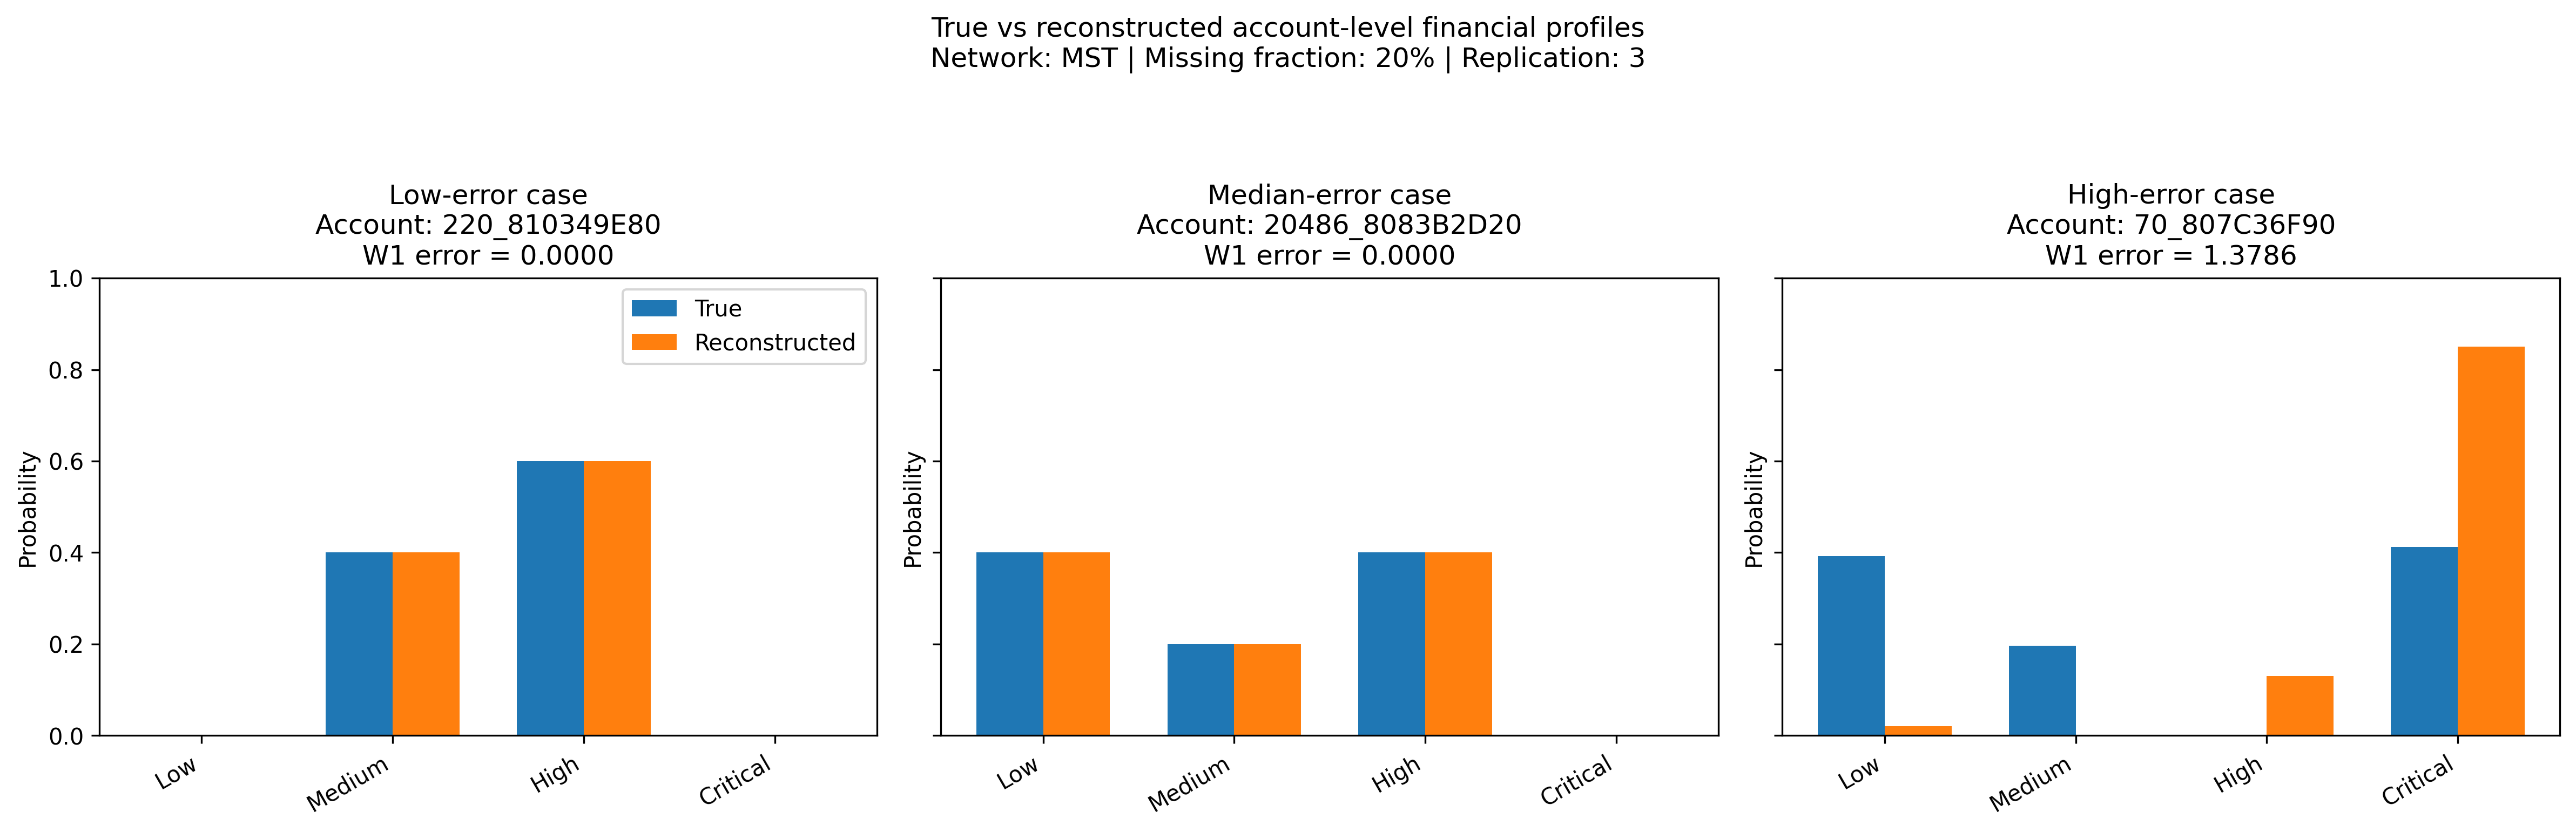
Figure “True Reconstructed Mst” shows how Wasserstein reconstruction errors translate into differences between empirical and reconstructed financial profiles. Low-error cases correspond to accounts for which the reconstructed probability mass is very close to the true distribution across the ordered amount classes. The median-error case represents the typical reconstruction behaviour and shows whether the dominant transaction amount classes are preserved. The high-error case highlights the main limitation of the propagation approach: some accounts exhibit financial profiles that are difficult to infer from their behavioural neighbours.
The visual inspection also helps interpret the difference between mean and median Wasserstein errors. Since median errors are much smaller than mean errors, most hidden profiles are reconstructed accurately, while a smaller number of atypical accounts generate larger errors. The figure therefore supports the conclusion that reconstruction performance is generally strong, but heterogeneous across accounts.
The empirical comparison highlights the role of network topology in account-level financial profile reconstruction. The COS network uses all pairwise behavioural similarities and therefore allows information to propagate globally across the full set of selected accounts. Although this provides the richest connectivity structure, the results show that the fully connected network does not produce the most accurate reconstructions. This suggests that using all available similarities may introduce over-smoothing, since many weakly related accounts contribute to the reconstruction of each hidden profile.
The KNN network introduces a local propagation mechanism by restricting each account to its closest behavioural neighbours. This structure appears effective in preserving account-level behavioural similarity, as it consistently reduces reconstruction errors relative to the COS network. The KNN results suggest that local neighbourhood information is more informative than global averaging for reconstructing transaction amount distributions. However, because the KNN network may contain multiple connected components, propagation remains restricted within local regions of the graph.
The MST network provides the sparsest connected structure. It preserves global connectivity while using only the minimum number of edges required to connect all accounts. Despite its extreme sparsity, the MST network achieves reconstruction errors that are comparable to, and in some cases slightly lower than, those of the KNN network. This indicates that a minimal behavioural backbone can preserve enough distributional information for accurate profile reconstruction. However, the MST network also requires more propagation iterations, especially at higher missing fractions, reflecting the longer paths through which information must travel.
Overall, the results show that sparse behavioural networks are preferable to the fully connected cosine similarity network for this reconstruction task. Both KNN and MST outperform COS in terms of mean and median Wasserstein errors, suggesting that selective propagation through behaviourally meaningful edges is more effective than global propagation through all pairwise similarities. In this sense, Wasserstein propagation can be used not only as a reconstruction method, but also as a network selection tool: by comparing reconstruction errors across candidate behavioural networks, it is possible to evaluate which topology best preserves the distributional information needed to reconstruct hidden financial profiles.
The empirical results show that account-level financial profiles can be reconstructed with relatively low Wasserstein error using behavioural network information. This supports the main idea of the paper: transactional behaviour can be represented not only through scalar summaries, such as total amount or transaction count, but also through probability distributions over ordered financial classes. Once account behaviour is represented distributionally, Wasserstein geometry provides a natural framework for comparing and reconstructing financial profiles.
A first important finding concerns the role of network sparsity. The fully connected COS network uses all pairwise account similarities, but it does not achieve the lowest reconstruction error. This suggests that global propagation may dilute relevant behavioural information by combining each hidden account with many weakly related accounts. In contrast, the KNN and MST networks impose more selective propagation structures and obtain lower reconstruction errors. This result indicates that, for account-level financial profile reconstruction, the quality and selectivity of behavioural links may be more important than the total number of available connections.
A second finding concerns the effectiveness of local behavioural neighbourhoods. The KNN network consistently improves reconstruction accuracy relative to the fully connected network. This suggests that accounts with similar transaction counts, transaction amounts, payment formats and amount-class distributions tend to provide useful information for reconstructing each other's hidden profiles. In financial applications, this is important because it supports the idea that behavioural similarity networks can encode meaningful account-level structure.
A third finding concerns the MST network. Despite being the sparsest network considered, the MST performs competitively with KNN and in some cases achieves slightly lower mean reconstruction error. This result suggests that a minimal behavioural backbone may preserve enough information to support accurate distributional propagation. However, the MST also requires more iterations to converge, especially as the missing fraction increases. This reflects the fact that information must travel through longer paths in a tree-like structure. Therefore, MST offers an interesting trade-off between sparsity, interpretability and computational propagation time.
From a methodological perspective, the proposed framework provides a way to evaluate behavioural banking networks through their ability to reconstruct hidden distributional profiles. Instead of selecting a network only on the basis of structural properties, such as density, clustering or average path length, the network can be assessed through a task-based validation criterion. A network is preferable if it better preserves the information needed to reconstruct masked account-level distributions. In this sense, Wasserstein propagation acts both as a reconstruction method and as a network validation tool.
From a financial perspective, the framework is relevant for transaction monitoring and risk-oriented banking analytics. The method does not require the reconstruction of individual transactions. Instead, it reconstructs aggregate account-level behavioural profiles. This distinction is important because many financial monitoring tasks are concerned with behavioural patterns rather than isolated payments. For example, an account characterized by a high proportion of critical-value transactions may be more relevant from a monitoring perspective than an account whose activity is concentrated in low-value transactions, even if both accounts have similar transaction counts.
The distributional representation also supports interpretability. Each reconstructed profile remains a probability vector over four ordered transaction amount classes: Low, Medium, High and Critical. Therefore, the output of the method can be directly inspected and compared across accounts. This differs from black-box embeddings or purely latent representations, where the meaning of each dimension may be harder to interpret. In the proposed framework, reconstruction errors can also be interpreted in terms of probability mass shifted across ordered financial categories.
Finally, the use of a synthetic AML dataset provides a controlled proof-of-concept environment. Since the data are synthetic, the analysis avoids direct exposure of real customer information while still preserving a transaction-level structure suitable for financial network experiments. This makes the framework relevant for privacy-preserving methodological development. However, the synthetic nature of the dataset also means that empirical conclusions should be interpreted as evidence on the behaviour of the proposed method rather than as direct claims about real banking systems.
This paper provides a proof-of-concept framework for reconstructing account-level financial profiles through Wasserstein propagation on behavioural banking networks. Although the empirical results are encouraging, several limitations should be acknowledged.
A first limitation concerns the nature of the data. The empirical analysis is based on a synthetic AML transaction dataset. This provides a useful and privacy-preserving environment for methodological experimentation, but it does not allow direct conclusions about real banking systems. Synthetic data may reproduce several realistic transactional mechanisms, but they may not fully capture the complexity, regulation, institutional constraints and strategic behaviour observed in real financial environments. Future work should therefore evaluate the proposed framework on real or institutionally validated transaction data, subject to appropriate privacy and compliance restrictions.
A second limitation concerns the construction of account-level financial profiles. In this paper, each account is represented as a probability distribution over four ordered transaction amount classes: Low, Medium, High and Critical. This representation is simple, interpretable and suitable for Wasserstein-based comparison. However, it captures only one dimension of transactional behaviour, namely the distribution of transaction amounts. Real financial behaviour may also depend on temporal patterns, payment frequency, counterparty diversity, currency usage, transaction direction and recurrence. Future extensions could define richer multidimensional financial profiles combining amount, time, payment format and counterparty information.
A third limitation is related to the discretization of transaction amounts. The four amount classes are constructed using global quantiles, ensuring a common support across accounts. While this makes profiles comparable, the choice of four classes is necessarily a simplification. A larger number of classes could provide a more detailed representation of transactional behaviour, while alternative discretization strategies could be based on regulatory thresholds, business rules or risk-sensitive financial categories. Future work should assess the robustness of reconstruction results to different choices of support and class definitions.
A fourth limitation concerns network construction. The candidate networks considered in this paper are built from manually selected behavioural features and include cosine similarity, K-nearest-neighbour and minimum spanning tree topologies. These networks are interpretable and computationally convenient, but they may not capture all relevant financial relationships between accounts. Alternative network construction methods could incorporate transaction flows directly, temporal co-activity, shared counterparties, community structure or supervised risk information. Future research could also investigate adaptive or learned network structures optimized for distributional reconstruction performance.
A fifth limitation concerns the reconstruction procedure. The proposed method uses a fast one-dimensional Wasserstein barycentric approximation, which is appropriate for ordered amount classes. However, this implementation is specifically tailored to one-dimensional discrete profiles. More complex financial profiles may require more general optimal transport algorithms, including entropic Wasserstein barycentres or multi-marginal formulations. Future work could compare the fast one-dimensional approximation with Sinkhorn-based barycentres and investigate the trade-off between computational efficiency and reconstruction accuracy.
Finally, the present study focuses on profile reconstruction rather than supervised AML classification. The objective is to reconstruct hidden account-level distributions, not to predict whether an account or transaction is suspicious. This distinction is important. The proposed framework should be interpreted as a tool for behavioural reconstruction and network validation, rather than as a complete AML detection system. A natural extension would be to combine reconstructed profiles with supervised or semi-supervised risk models, evaluating whether distributional reconstruction improves downstream fraud detection, AML alert prioritization or transaction monitoring tasks.
Overall, future work should move in three main directions. First, the empirical validation should be extended to richer and more realistic financial datasets. Second, account-level profiles should be expanded beyond transaction amount distributions to include temporal, relational and directional information. Third, Wasserstein propagation should be integrated with risk-oriented modelling tasks, so that reconstructed behavioural profiles can support practical applications in financial monitoring and privacy-preserving analytics.
This paper proposed a network-based distributional framework for reconstructing account-level financial profiles in banking transaction data. Each sender account was represented as an empirical probability distribution over ordered transaction amount classes, transforming raw transaction-level observations into interpretable account-level behavioural profiles. These profiles were then reconstructed through Wasserstein propagation on behavioural banking networks.
The proposed approach combines three main components. First, transaction amounts are discretized into ordered financial classes, allowing each account to be represented as a probability distribution over a common support. Second, behavioural networks are constructed from account-level features, including transaction counts, transaction amounts, payment formats and amount-class distributions. Third, hidden account-level profiles are reconstructed through iterative Wasserstein barycentric propagation, exploiting the similarity structure encoded by the network.
The empirical analysis, based on the IBM Transactions for Anti Money Laundering dataset, shows that hidden financial profiles can be reconstructed with relatively low Wasserstein error. The comparison between candidate networks indicates that sparse behavioural structures, especially KNN and MST, outperform the fully connected cosine similarity network. This suggests that selective propagation through behaviourally meaningful links is preferable to global propagation through all pairwise similarities. The visual comparison between true and reconstructed profiles further shows that most hidden profiles are accurately recovered, while larger errors are concentrated in a smaller number of atypical accounts.
The contribution of the paper is both methodological and financial. Methodologically, the framework shows how optimal transport and Wasserstein geometry can be used to compare, reconstruct and validate account-level distributional objects on banking networks. Financially, the approach provides an interpretable tool for analysing transactional behaviour at the account level, with potential relevance for privacy-preserving analytics, transaction monitoring, fraud detection and AML-oriented research.
The paper should be interpreted as a proof of concept rather than as a complete operational AML system. The analysis is based on synthetic data, and the reconstructed profiles describe aggregate transaction amount behaviour rather than suspiciousness directly. Nevertheless, the results suggest that Wasserstein propagation on behavioural networks is a promising direction for reconstructing hidden financial profiles and for evaluating which network structures best preserve behavioural information in banking transaction data. apalike